A business valuation report is only useful if it reflects reality. We at Unbroker have seen countless valuations that miss the mark because they rely on outdated assumptions or flawed comparisons.
Real valuation report examples show you exactly how professional valuers build credible numbers. This post walks through actual industry benchmarks and the methods that produce defensible results.
What Goes Into a Real Valuation Report
The Three Layers of Evidence
A valuation report worth reading contains three layers of evidence that professional buyers and investors actually examine. The first layer is your financial history-specifically, how your business performed over the last three to five years. This means normalized financial statements, not just tax returns. Normalized statements strip out one-time expenses, owner perks, and accounting quirks to show what a buyer would actually inherit. If your owner takes a $200,000 salary but the market rate for that role is $100,000, a valuer adds back $100,000 to earnings. If you write off a family member’s car as a business expense, that gets reversed. These adjustments matter because they determine your cash flow-the actual money a buyer can extract from the business.
Market Benchmarks That Anchor Your Multiple
The second layer is comparable data. A valuer examines real transactions in your industry and similar-sized companies to anchor the multiple they apply to your earnings. EBITDA multiples typically range from 3x to 5x for small businesses and 6x to 12x or higher for larger, growth-oriented companies. This isn’t guesswork; it reflects what actual buyers paid for actual businesses. Verifiable sources-Capital IQ, industry databases, or documented M&A transactions-provide the foundation for these comparables, not anonymous estimates.
Forward-Looking Assumptions and Discount Rates
The third layer is forward-looking assumptions about growth and risk. A valuer projects your cash flows three to seven years out and applies a discount rate that accounts for how risky those projections are. A stable, recurring-revenue business receives a lower discount rate than a volatile, project-based one. The discount rate calculation starts with the weighted average cost of capital (WACC), which measures the average cost a company incurs to finance its operations using debt and equity. A growth rate that exceeds long-term nominal GDP growth of roughly 6% needs strong justification.
How a Strong Report Presents Its Logic
Your financials should separate cost of goods sold from operating expenses to show gross profit and net operating income separately. Owner compensation should appear as a line item distinct from return on investment, because a buyer cares about what the business generates after paying market-rate salaries. The discount rate calculation should show its components so you understand why the valuer chose 18% instead of 25%. A weak report skips these details, hands you a number, and expects you to trust it. A strong report shows you every assumption and lets you push back if something doesn’t match your business reality. When you move forward with a valuation, the quality of these three layers determines whether your number holds up in negotiations or falls apart under scrutiny.
How Different Industries Use Valuation Methods
Manufacturing: Asset Value Meets Margin Reality
Manufacturing businesses live and die by their assets. A factory with specialized equipment, inventory, and production capacity requires an asset-based valuation that accounts for the replacement cost of machinery, the fair market value of raw materials and work-in-progress, and the condition of the facility. Equipment age matters enormously. A five-year-old CNC machine worth $500,000 new might sell for $200,000 used, and a valuer must adjust for obsolescence. The income approach still applies, but only after you normalize for the fact that manufacturing margins compress during downturns.
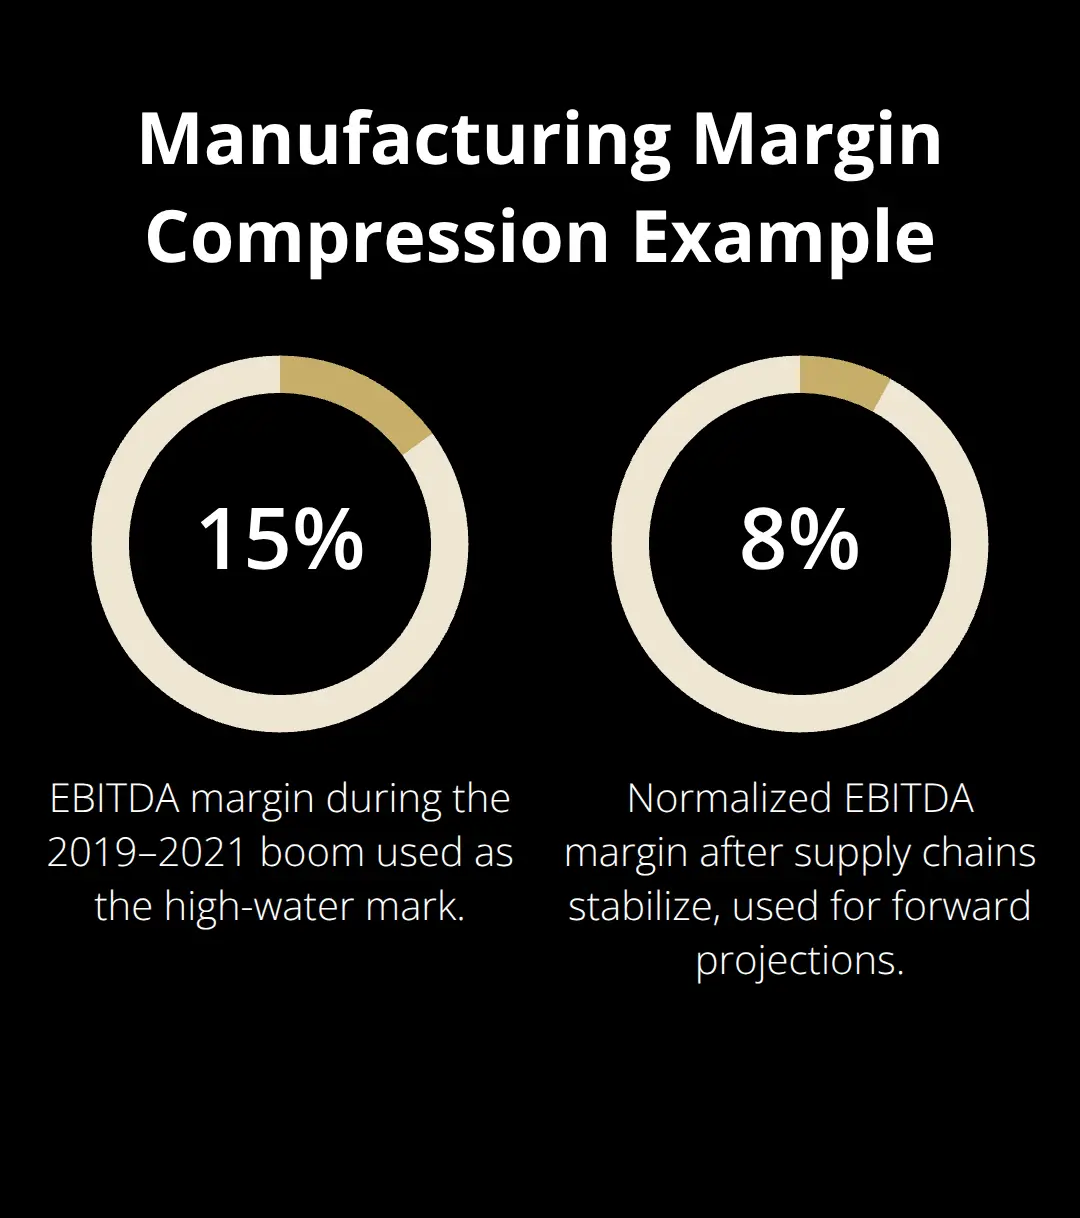
If your business generated 15% EBITDA margins during the 2019-2021 boom but drops to 8% when supply chains normalize, a buyer will project forward at the lower rate. This is why three to five years of historical financials matter for manufacturing: they show whether your margins are sustainable or inflated by temporary conditions. Many manufacturing owners overestimate their valuation because they anchor to their best year instead of their normalized performance.
SaaS and Technology: Growth Rate Drives the Multiple
SaaS and technology companies trade on recurring revenue and growth rates, not asset value. A SaaS company with $2 million in annual recurring revenue growing at 40% year-over-year commands a vastly different multiple than one growing at 5%. High-growth SaaS typically trades at 8x to 12x revenue, while slower-growth or mature SaaS trades at 3x to 5x revenue. The discount rate calculation shifts dramatically for tech because investors price in both the cost of capital and the growth trajectory. A 25% annual growth rate justifies a lower discount rate than a 3% growth rate, even if both are stable. Customer acquisition cost relative to lifetime value determines sustainability. If you spend $5,000 to acquire a customer who generates $25,000 in lifetime value, that’s defensible. If your CAC approaches your LTV, your growth story collapses under scrutiny.
Service Businesses: Recurring Revenue and Client Concentration
Service-based businesses like agencies, consulting firms, and brokerages depend almost entirely on recurring revenue and client retention. Digital agencies with 60% to 70% of revenue from retainer contracts command valuations around 11.6x EBITDA as of 2025, according to industry benchmarks, while project-based shops trade at 9x EBITDA or lower. Client concentration kills valuation. If one client represents more than 25% of revenue, buyers apply a 15% to 30% discount to the multiple because they assume that client will leave after the sale. Insurance brokers hit even higher multiples, averaging 11.8x EBITDA through the first half of 2025, up sharply from 9.4x in 2020, because their client books generate predictable, long-term commissions.
The Owner Dependence Problem
Owner dependence cuts the opposite direction. A founder-centric agency where clients work only with the owner faces a 15% to 30% discount unless you document processes, hire capable managers, and prove the business runs without you. Niche specialization strengthens value. A healthcare marketing agency or B2B SaaS marketing firm commands higher multiples than a generalist shop because switching costs are higher and relationships run deeper.
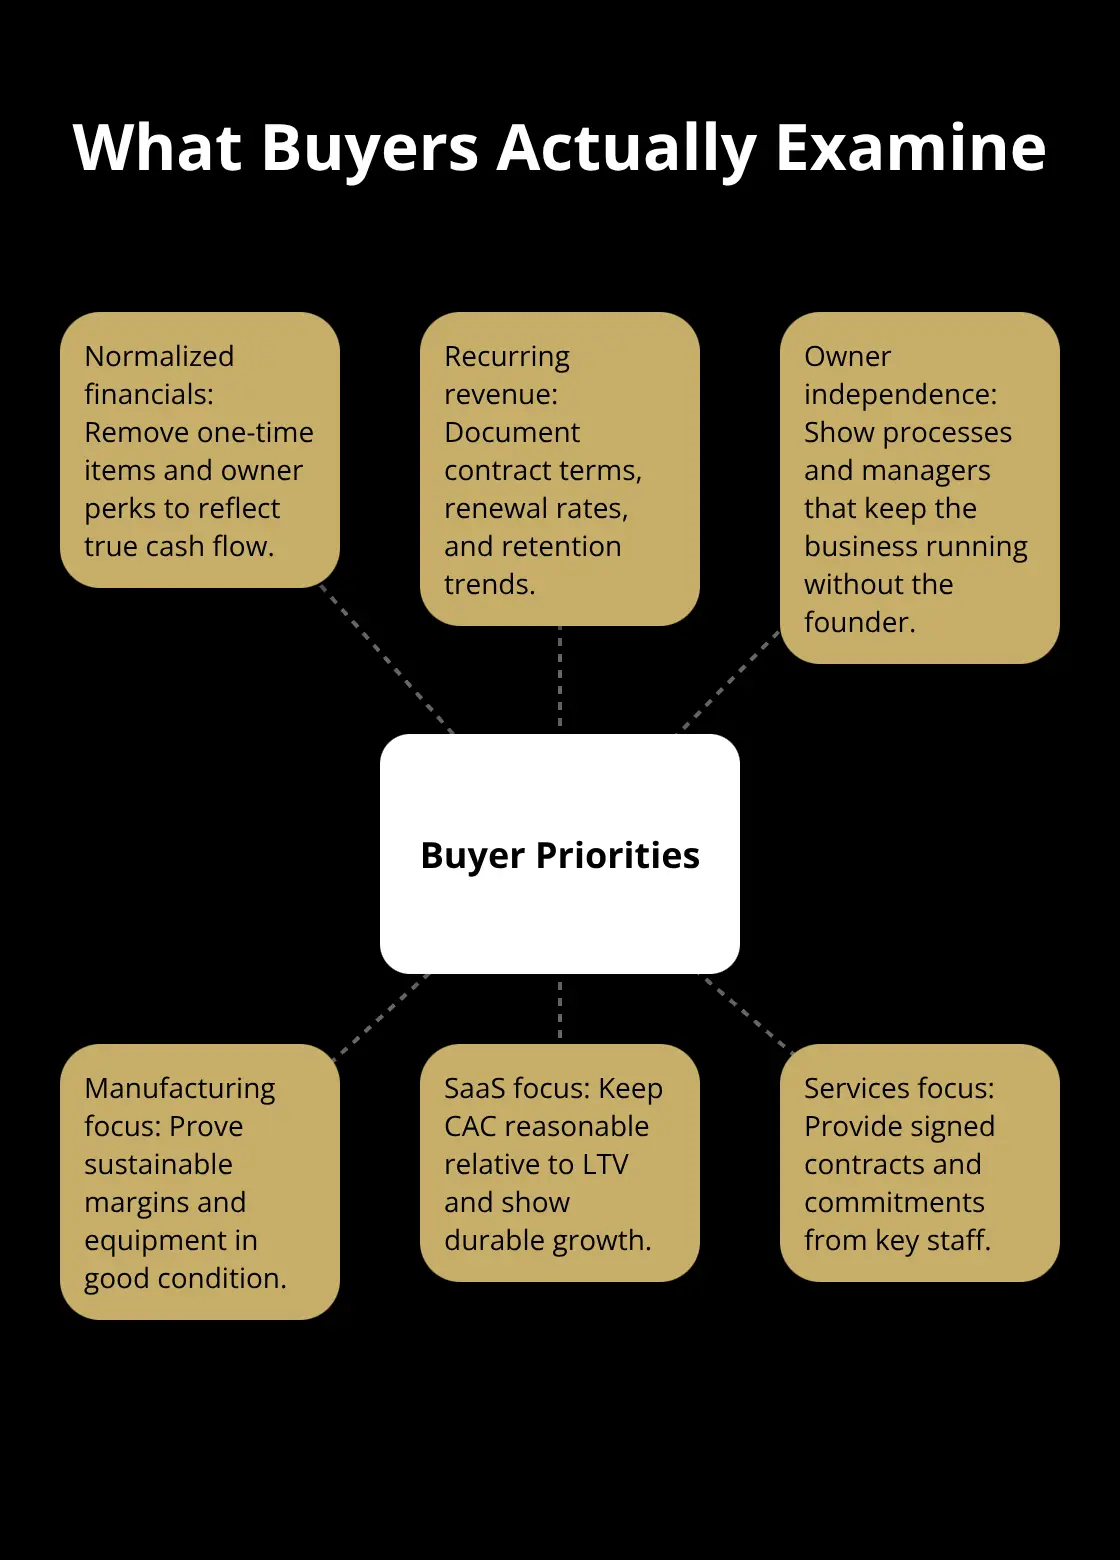
What Buyers Actually Examine
Across all three categories, buyers examine the same fundamentals: normalized financials that strip out one-time items, documented recurring revenue streams, and evidence that the business operates independently of you. A manufacturing buyer wants to see sustainable margins and equipment in good condition. A SaaS buyer wants proof that customer acquisition costs remain reasonable relative to lifetime value. A service-business buyer wants contracts locked in and key staff committed to stay.
When you prepare for a valuation, these industry-specific factors determine whether your number holds up or falls apart. The next section walks through the specific valuation methods that professionals apply to each scenario and shows you how to choose the right approach for your business.
Which Valuation Method Works for Your Business
Asset-Based Valuation for Tangible-Heavy Companies
Asset-based valuation works best when your company’s value sits primarily in tangible assets like machinery, inventory, real estate, or equipment. A manufacturing plant with $3 million in specialized CNC equipment and $800,000 in working capital has real, replaceable value that forms the floor for any deal. You calculate replacement cost for each asset, subtract accumulated depreciation based on condition and age, and add back working capital. This method fails badly for service businesses or software companies where most value lives in client relationships and intellectual property rather than physical things.
Income Approach for Stable, Profitable Businesses
For profitable, established companies with predictable cash flows, the income approach dominates. You project normalized cash flow forward three to seven years, apply a discount rate that reflects your business’s risk profile, and calculate present value. A consulting firm generating $500,000 in annual net adjusted free cash flow with stable clients and low customer acquisition costs warrants a lower discount rate-perhaps 18% to 22%-than a volatile project-based shop facing client turnover.
The discount rate components matter significantly. Start with the risk-free rate around 5%, add an equity risk premium of 6% to 7%, then layer on company-specific risk premiums that range from 0% to 10% depending on stability, management quality, and market position. This produces required rates of return anywhere from 11% to 22%, and that range swings your valuation dramatically. A $500,000 cash flow divided by a 15% discount rate yields $3.33 million, but at 22% it drops to $2.27 million.
Market Approach Using Real Transaction Data
The market approach uses comparable company multiples from real M&A transactions and public market benchmarks to anchor your valuation. If digital agencies sold at 11.6x EBITDA in 2025 and your agency generates $1 million EBITDA, you’re worth roughly $11.6 million-assuming your business matches the profile of those comparable deals. The critical mistake most owners make: they grab the highest multiple they’ve heard and ignore deal-specific adjustments.
A buyer applies discounts immediately if your client concentration exceeds 25% of revenue, if the founder is irreplaceable, or if your recurring revenue percentage trails industry norms. Insurance brokers command 11.8x EBITDA multiples because their client books are sticky and recurring, but only if those clients actually renew. A broker with five-year average retention above 90% gets the full multiple; one with 70% retention faces a 20% to 30% haircut.
Selecting the Right Method for Your Situation
Choose asset-based valuation only if assets represent over 60% of your enterprise value. Choose income-based valuation for any stable, profitable business where you can project cash flows with reasonable confidence-this is the gold standard for most middle-market sales. Choose market-based multiples to sanity-check your income-based number and to frame negotiations with informed buyers.
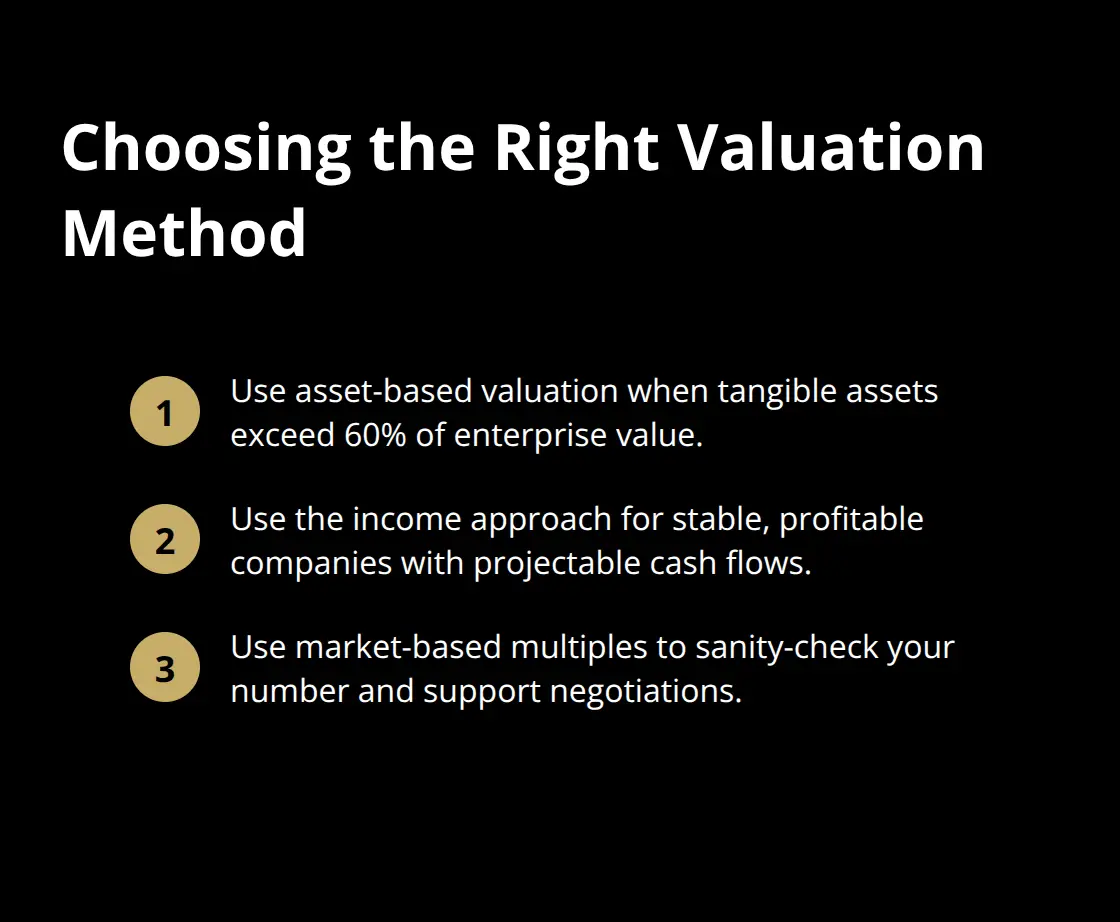
The strongest valuations use all three methods and show where they converge, because convergence proves your number is defensible.
Final Thoughts
A real valuation report anchors your asking price to defensible numbers that buyers respect. The valuation report examples throughout this post reveal a consistent pattern: businesses with normalized financials, documented recurring revenue, and sustainable margins command higher multiples and close faster, while businesses with owner dependence, concentrated clients, or inflated margins face discounts that reduce their value significantly. The difference between an accurate valuation and an inflated one often determines whether your sale succeeds or stalls.
Buyers today expect transparency and want to see your three to five years of normalized financials, understand your discount rate calculation, and verify your comparable multiples against real market data. When your valuation holds up under scrutiny, negotiations move faster and you close at a price closer to your target. Start with honest financial preparation: strip out one-time expenses and owner perks, document your recurring revenue streams and client retention rates, and gather clean, auditable financials that reflect your actual performance.
We at Unbroker help business owners navigate this process with transparent, low-cost options that eliminate the traditional brokerage markup. Get your business valued with access to a buyer network, professional marketing tools, and expert guidance on valuation and negotiation that reflects your actual market position.