Valuing a business comes down to one thing: understanding what its cash will be worth in the future. At Unbroker, we’ve seen countless investors and business owners struggle with cash flow valuation methods because they don’t know which approach fits their situation.
This guide walks you through the most practical valuation techniques, from discounted cash flow analysis to internal rate of return calculations. You’ll learn when to use each method and how to apply them to real businesses.
How Discounted Cash Flow Valuation Actually Works
The Core Principle Behind DCF
Valuing a business comes down to understanding what its cash will be worth in the future. The discounted cash flow method projects what a business will earn and adjusts those future earnings for inflation and risk. A dollar you receive five years from now is worth less than a dollar today because you could invest that dollar today and earn returns. This is the time value of money in action. To apply DCF properly, you need three things: realistic cash flow projections, a discount rate that reflects your investment’s risk level, and the discipline to avoid inflating numbers.
Building Realistic Cash Flow Projections
Most valuations fail because people project growth that’s too aggressive. A company with 3% annual revenue growth should not suddenly show 12% growth in year three without a clear reason. Conservative projections protect you from overpaying. Start by forecasting free cash flow for five to ten years. Free cash flow is the amount of cash that a company has left after accounting for spending on operations and capital asset maintenance. It’s not revenue or profit-it’s actual cash available to investors.
Many valuations use EBITDA or net income instead, which creates massive errors because they ignore capital expenditures and working capital needs. A company might show strong profits while bleeding cash because it’s buying new equipment or building inventory. Spend time normalizing historical cash flows by removing one-time events, owner perquisites, and related-party distortions. If the owner paid themselves an above-market salary, adjust it down to what a hired manager would cost. If the business had one exceptional year due to a one-time contract, don’t extrapolate that into perpetuity. Use actual historical data from the past three to five years as your foundation, then make conservative adjustments for known changes ahead.
Selecting the Right Discount Rate
Your discount rate should reflect both the risk-free rate (typically the yield on long-term government bonds, around 4–5% in 2026) and the additional risk of your specific investment. A mature, stable business might use a 7–9% discount rate, while a growth company in a competitive market could require 12–15%. This rate is called the weighted average cost of capital when you value an entire firm.
Calculating Terminal Value Correctly
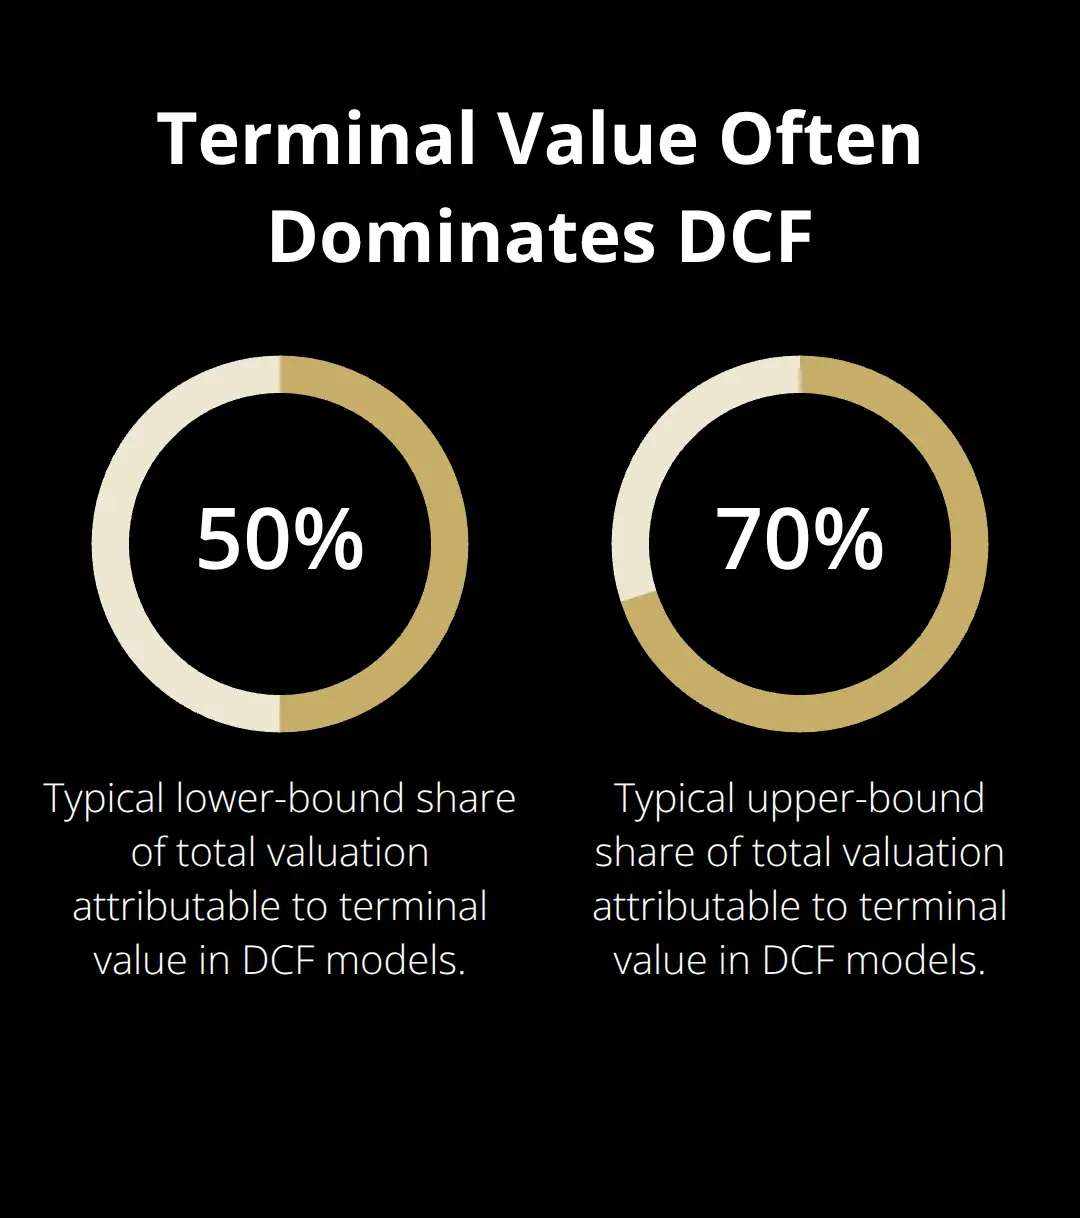
The terminal value-the value of all cash flows beyond your forecast period-typically accounts for 50–70% of the total valuation. This means your assumptions about long-term growth matter enormously. Using a perpetuity growth rate above 3% is aggressive and usually unjustified. Most stable businesses should assume 2–3% growth in perpetuity, aligned with long-term GDP expectations.
The Gordon Growth Model calculates this: final year free cash flow multiplied by one plus your growth rate, then divided by your discount rate minus the growth rate. If your discount rate and growth rate are too close, the formula produces unrealistic numbers. This is a red flag that your assumptions need adjustment.
Testing Your Assumptions with Sensitivity Analysis
The practical reality is that DCF valuation is only as good as your inputs. Garbage projections create garbage valuations. Sensitivity analysis is non-negotiable. Build your base case valuation, then test what happens if your discount rate increases by 1%, or if revenue growth drops by half. If a small change in assumptions produces wildly different valuations, you don’t have enough conviction to act on the analysis. The valuation should be robust enough that reasonable changes in inputs don’t flip your conclusion.
With your DCF foundation solid, you can now compare this method against other approaches that measure value differently-each with its own strengths and weaknesses depending on what you’re trying to evaluate.
Beyond DCF: When Other Methods Matter
NPV Tells You Dollar Value, IRR Shows Percentage Returns
Net present value and internal rate of return answer different questions, and your choice between them depends on what you actually need to know. Net present value calculates the absolute dollar gain or loss from an investment in today’s money. If you evaluate whether to buy a business for $500,000 that will produce $150,000 in free cash flow annually for ten years at a 10% discount rate, NPV measures the difference between what those future cash flows are worth today and what you pay upfront. A positive NPV means the investment creates value at your required return rate; a negative NPV signals value destruction. Internal rate of return reverses this approach by calculating the percentage return your investment actually generates, independent of what rate you demanded initially. An IRR of 8% on that same business tells you the actual return, which you then compare against your 10% hurdle rate to decide whether to proceed.
Why IRR Misleads When Comparing Different Investments
The problem with IRR surfaces when you compare projects of different sizes or timeframes. IRR does not take into account the total return or the size of the investment, which means a small investment producing 25% IRR might create less wealth than a larger investment returning 12% IRR because NPV accounts for scale and absolute dollars gained. Many investors fixate on IRR percentages and overlook that a smaller pool of capital producing high returns leaves them with less total wealth than deploying more capital at moderate returns. A $50,000 investment at 25% IRR generates $12,500 in annual returns, while a $1,000,000 investment at 12% IRR generates $120,000 annually. The percentage looks better, but the dollars tell the real story.
Payback Period: A Risk Filter, Not a Decision Tool
Payback period measures how many years it takes to recover your initial investment through cash flows, completely ignoring what happens after breakeven. This metric matters most for early-stage or highly uncertain investments where you want protection against extended cash drains, but it should never be your primary decision mechanism. A business with a two-year payback period looks attractive until you realize it produces negative cash flow in years three through ten. Payback period works best as a risk screen alongside other valuation methods, not as a standalone approach.
Combining All Three Methods for Stronger Decisions
The practical approach combines all three methods rather than selecting one. Start with NPV using your required return rate to determine if an investment creates value at your threshold. Check the IRR to see if it exceeds your hurdle rate and understand the actual return percentage. Use payback period as a risk filter, especially for businesses in volatile industries or with unproven models.
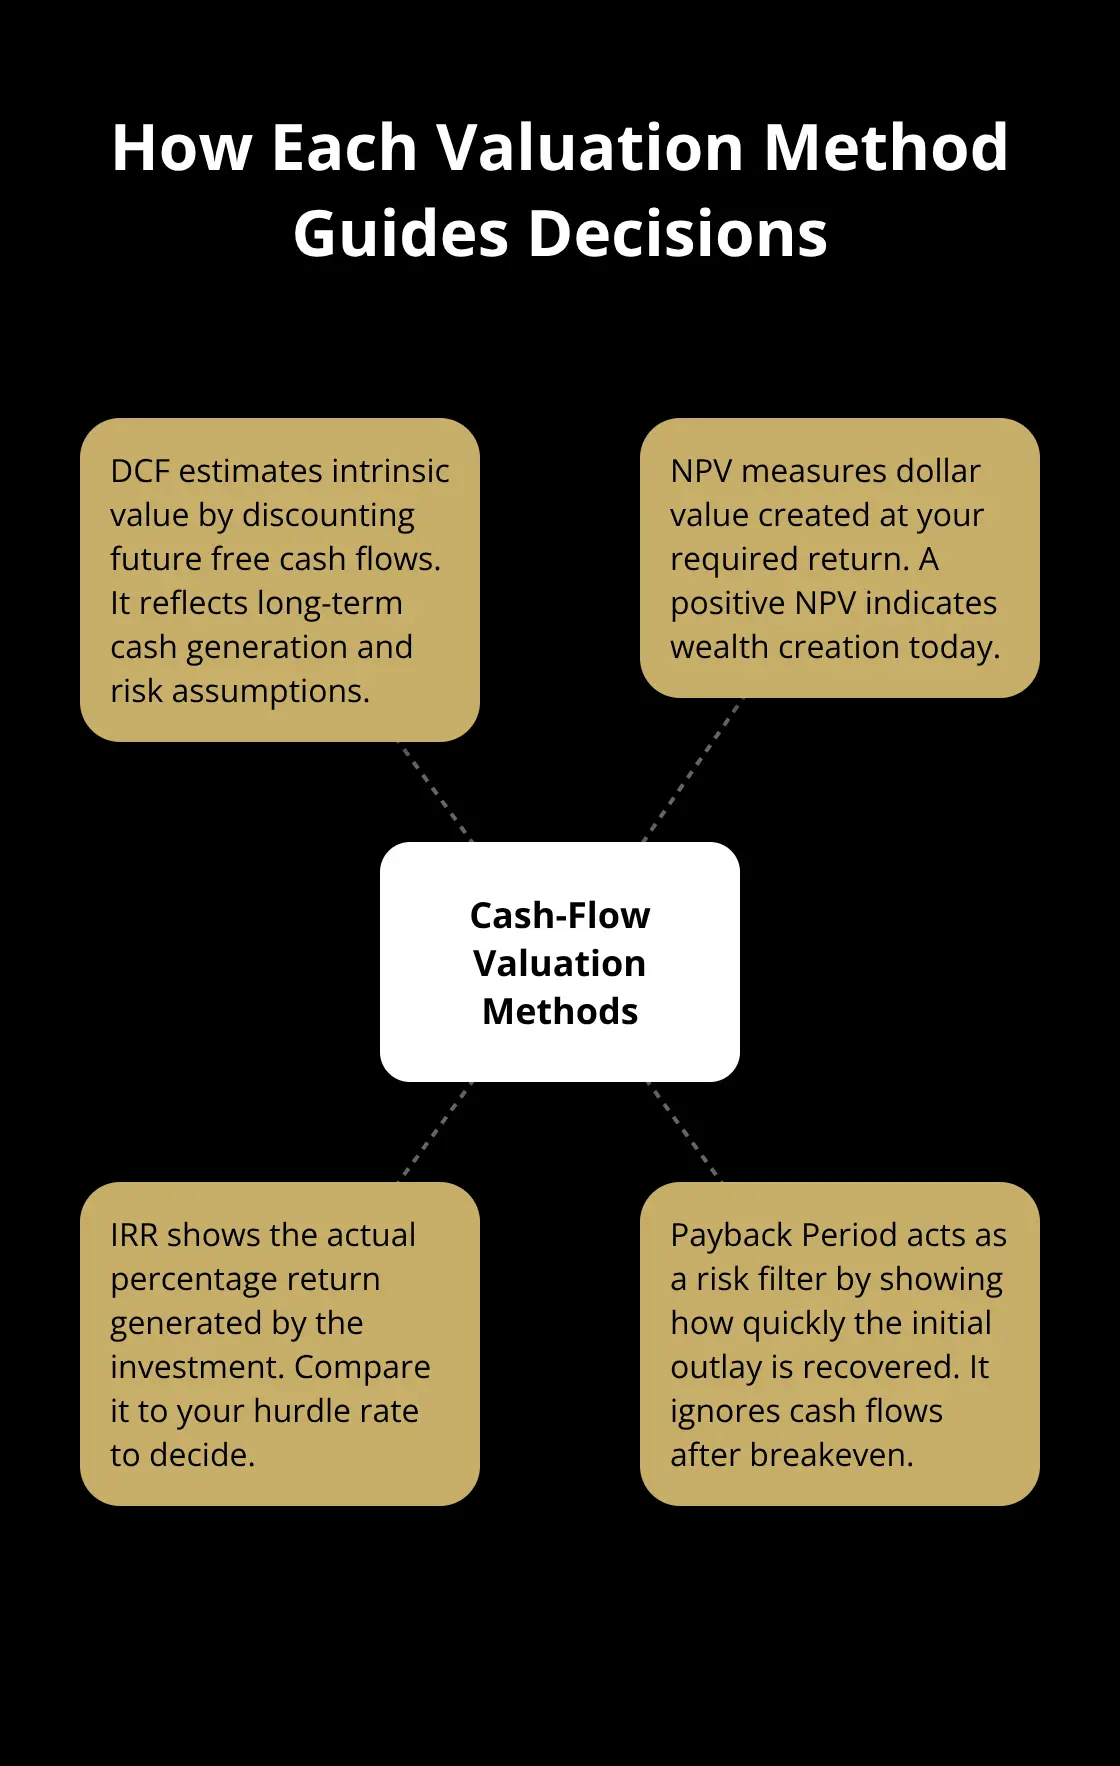
If NPV is positive, IRR exceeds your required return, and payback occurs within five years, you have alignment across methods and higher conviction in the decision. When these three conflict, NPV should win because it directly measures wealth creation in dollars you can spend today.
Testing All Three Methods with Sensitivity Analysis
Test your assumptions the same way you did with DCF by running sensitivity analysis on all three methods. If small changes in cash flow timing or discount rates reverse your decision, the investment isn’t clear enough to pursue. The most common mistake investors make is using IRR alone and ignoring that a 30% return on a $10,000 investment produces less wealth than a 12% return on a $1 million investment. Once you’ve validated your numbers across NPV, IRR, and payback period, you’re ready to apply these methods to real businesses and see how they perform in practice.
How Real Businesses Perform Across Valuation Methods
SaaS Companies Reveal Tension Between Valuation Approaches
When you move from theory to actual businesses, valuation methods often produce conflicting signals. A software-as-a-service company with $2 million in annual free cash flow and minimal capital expenditure requirements might show a DCF valuation of $18 million at a 12% discount rate, but an NPV calculation of the same business purchased for $15 million produces a positive $3 million gain at your required 15% return threshold. The IRR on that $15 million investment might calculate to 14.8%, just below your 15% hurdle rate, creating tension between methods. This happens because DCF values the entire business on perpetuity assumptions, while NPV anchors to your actual required return and investment size. The payback period sits at six years, which matters less for a stable SaaS business but signals meaningful cash tieup.
Manufacturing Businesses Demand Different Assumptions
A manufacturing business tells a different story entirely. With $3 million in annual free cash flow but $800,000 in required annual capital expenditures to maintain equipment, the same DCF model at 10% produces $28 million in value. However, the NPV calculation at a 10% hurdle rate shows only $2 million in value creation if you pay $26 million, and the IRR might be 10.3%, barely exceeding your threshold. The payback period stretches to eight years because capital intensity consumes cash flow that other businesses distribute. A mature distribution company generating $5 million in free cash flow with $300,000 annual capex and 2% growth shows a DCF value around $55 million at 8%, but NPV analysis reveals you would destroy $5 million in value paying $60 million for it at your 8% required return. The IRR would be 7.2%, below your hurdle.
Why Method Variance Reflects Real Business Differences
These aren’t theoretical exercises. The variance between methods reflects real differences in how much cash the business actually produces, how much risk you accept, and whether you overpay relative to your return requirements. A consulting firm with 40% of revenue from a single client carries execution risk that should push your discount rate from 10% to 13%, compressing valuations by roughly 20%. A manufacturer with aging equipment requires higher capex assumptions going forward, reducing free cash flow projections by 15% or more. A retail business with five-year leases faces renewal risk that makes payback period critical because breakeven must occur before lease expiration.
Applying Industry-Specific Adjustments to Your Analysis
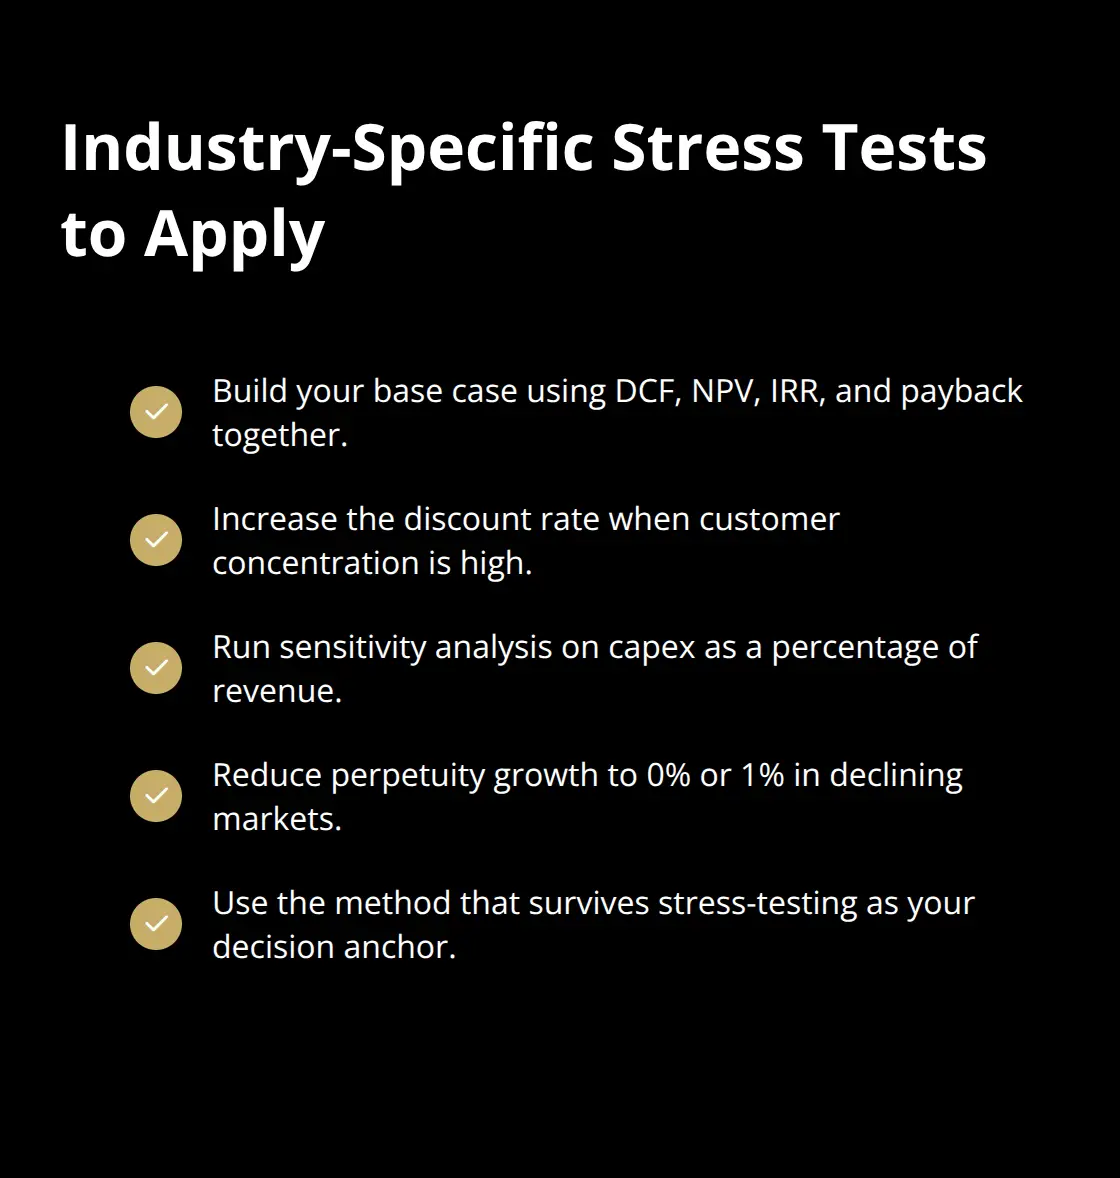
Most valuation errors stem from applying the same discount rate and growth assumptions across different business models rather than adjusting for what actually drives cash generation in each industry. A high-growth technology business should use a higher discount rate than a stable utility, yet many investors reverse this logic and apply lower rates to growth companies because they feel excited about the opportunity. The practical discipline is this: build your base case valuation using all three methods, then stress-test each one for industry-specific risks. If the business depends on customer concentration, increase your discount rate. If capex requirements are uncertain, run sensitivity analysis on capex as a percentage of revenue. If the business operates in a declining market, reduce your perpetuity growth rate to 0% or 1%. The method that survives stress-testing with conviction becomes your decision anchor.
Final Thoughts
Cash flow valuation methods work best when you treat them as a system rather than isolated tools. DCF establishes what a business is fundamentally worth based on perpetual cash generation, NPV tells you whether a specific investment at your required return rate creates wealth, and IRR shows you the actual percentage return you’ll earn. Payback period protects you against extended cash drains in uncertain situations, and none of these approaches is universally superior-choosing one over the others guarantees mistakes.
Strong valuations combine all three approaches with rigorous stress-testing. Start with DCF to establish intrinsic value, run NPV analysis using your actual required return rate to determine if you create value at your threshold, calculate IRR to see if the actual return exceeds your hurdle rate, and use payback period as a risk screen for volatile industries. Small changes in discount rates, growth rates, or capital expenditure requirements should not flip your conclusion-if they do, your analysis lacks the robustness to act on it.
Industry-specific adjustments matter enormously because a SaaS business with minimal capex requires different assumptions than a manufacturer with heavy equipment needs (and a consulting firm dependent on a few large clients needs a higher discount rate than a diversified service provider). Whether you’re buying or selling, the discipline of applying multiple cash flow valuation methods protects you from overpaying or underpricing what could be your most significant financial decision, and Unbroker helps business owners sell with transparent pricing and expert support through our Full Service and Assisted Business Sale options.