Business valuation isn’t guesswork. The income approach valuation method converts what a company actually earns into a realistic market price.
At Unbroker, we’ve seen too many valuations fail because they ignore cash flow reality or misapply discount rates. This guide walks you through the mechanics, the metrics that matter, and the mistakes that sink valuations.
How the Income Approach Converts Earnings Into Value
The income approach rests on a single economic truth: a business is worth what it can generate in future cash. Unlike asset-based or market-based methods, this approach forces you to think like an investor. You’re not asking what comparable companies sold for or what the balance sheet says. You’re asking what cash will actually flow to an owner over time, and what rate of return justifies that investment today. The process has three mechanical steps, but each one demands realistic assumptions grounded in actual business performance, not wishful thinking.
Start with Historical Earnings, Then Project Forward
Most valuers make their first mistake here by jumping straight to forecasts without cleaning the numbers. Historical earnings need normalization before they mean anything. This means removing one-time items, discretionary owner expenses, and non-operational costs that distort what the business actually earns year to year. If the owner paid themselves an inflated salary or absorbed a lawsuit settlement in year two, you adjust those out. A business with $500,000 in reported earnings but $80,000 in owner perks and $30,000 in non-recurring legal costs really generates $610,000 in normalized earnings. That’s your true starting point.
From there, you forecast three to five years of cash flows based on industry growth rates, the company’s competitive position, and documented management plans. The IRS and professional appraisers expect you to use industry benchmarks and market data, not generic assumptions. If your industry grows at 3 percent annually but you project 10 percent growth, you need hard evidence. Overestimating revenue growth is the single most common error in income valuations, and it inflates value dramatically because small percentage changes compound over years.
The Discount Rate Captures Risk and Time Value
Once you have projected cash flows, you must convert them to present value. That conversion requires a discount rate, and this is where most valuations fall apart. The discount rate reflects two things: what investors could earn elsewhere (the risk-free rate plus inflation) and the specific risk of this business achieving those cash flows. A stable, profitable business with long customer contracts might justify a 10 percent discount rate. A startup with one customer and thin margins might demand 25 percent or higher.
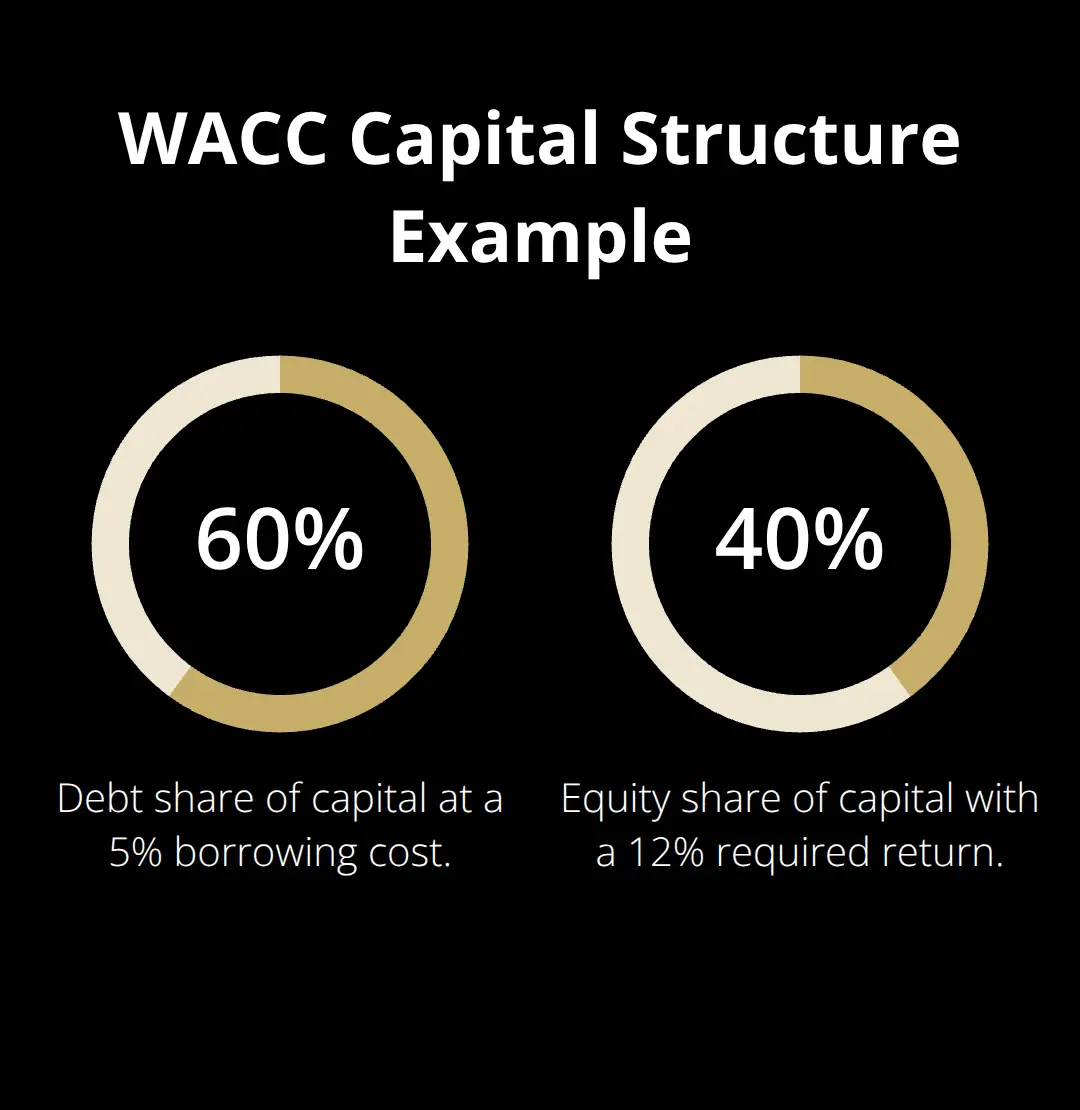
The weighted average cost of capital approach is standard in professional practice. It measures the average cost a company incurs to finance its operations using debt and equity. If a business finances itself with 60 percent debt at 5 percent and 40 percent equity where investors demand a 12 percent return, the blended rate is roughly 8.2 percent.
Selecting the wrong discount rate is not a minor error. A one-percentage-point difference between 9 percent and 10 percent can shift a $5 million valuation by $500,000 or more. Your discount rate must reflect company-specific risks like customer concentration, key-person dependencies, and competitive vulnerabilities, not generic industry rates. Many valuers apply a 12 percent rate across different business types and risk profiles, which is lazy and indefensible.
Terminal Value Is Where the Big Numbers Hide
After projecting five years of cash flows, you calculate a terminal value representing all cash flows beyond year five. This typically accounts for 60 to 80 percent of total value in a DCF model, which means a small error in terminal value assumptions creates massive valuation swings. The perpetuity growth method is most common: you assume the business grows at a stable, sustainable rate forever and apply a simple formula. If year-five cash flow is $1 million, your discount rate is 9 percent, and you assume 3 percent perpetual growth, terminal value is $1 million times 1.03 divided by 0.06, which equals roughly $17 million. That single number often dwarfs the value of explicit five-year projections.
The danger is obvious. Assuming 4 percent perpetual growth instead of 3 percent pushes terminal value to $23 million. You’ve added $6 million in value with a one-percentage-point change in an assumption no one can verify. Professional standards require you to justify terminal growth rates using long-term inflation forecasts and industry maturity. A mature, slow-growth business should not assume terminal growth above inflation. Conversely, a business in a structurally growing sector might justify 4 or 5 percent. The key is documentation and defensibility, not reaching a predetermined valuation target.
Why Discount Rates and Cash Flows Must Align
Many valuers make a fatal mistake by double-counting risk. They apply a high discount rate to conservative cash flow projections, or they use a low discount rate with aggressive growth assumptions. These mismatches destroy valuation credibility. Your discount rate and your cash flow projections must reflect the same risk environment. If you project 8 percent annual growth, your discount rate should reflect the risk of achieving that growth, not some generic industry average. If you use a conservative 6 percent growth assumption, your discount rate can be lower because you’ve already built caution into the cash flows themselves. This alignment separates defensible valuations from ones that collapse under scrutiny.
The income approach demands that you think like a buyer, not a seller. You’re translating what a business earns into what an investor should pay today. That translation depends entirely on the quality of your assumptions and your willingness to challenge them with market data. The next section examines the specific metrics and formulas that turn these assumptions into a final valuation number.
Key Metrics and Formulas in Income Valuation
The Capitalization Rate: Your Market Anchor
The capitalization rate sits at the core of direct capitalization methods, which work best for stable, mature businesses with predictable income streams. This rate represents the relationship between annual income and business value, expressed as a percentage. If a business generates $200,000 in normalized annual cash flow and sells for $2 million, the implied capitalization rate is 10 percent. This rate tells you what investors in that market will pay for each dollar of income.
Most valuers source capitalization rates from incomparable transactions or apply generic benchmarks without adjustment. Your rate must come from actual sales of similar businesses in similar markets during similar economic conditions. If you’re valuing a dental practice in suburban Atlanta, you need capitalization rates from recent dental practice sales in that region, not national averages. A one-half-percentage-point difference between 8 percent and 8.5 percent capitalization rates swings a $200,000 income stream from a $2.5 million valuation to $2.35 million. The market determines these rates through observable transactions, and your job is to find those transactions and adjust them for differences in risk, location, and business quality.
Present Value: Converting Future Cash to Today’s Dollars
Present value of future cash flows calculations take your projected cash flows and discount them backward to today’s dollars using your chosen discount rate. This is mechanical math, but the output only matters if your inputs are sound. Year one’s projected $250,000 cash flow discounted at 10 percent equals $227,273 today. Year two’s $260,000 becomes $214,876 in present value.
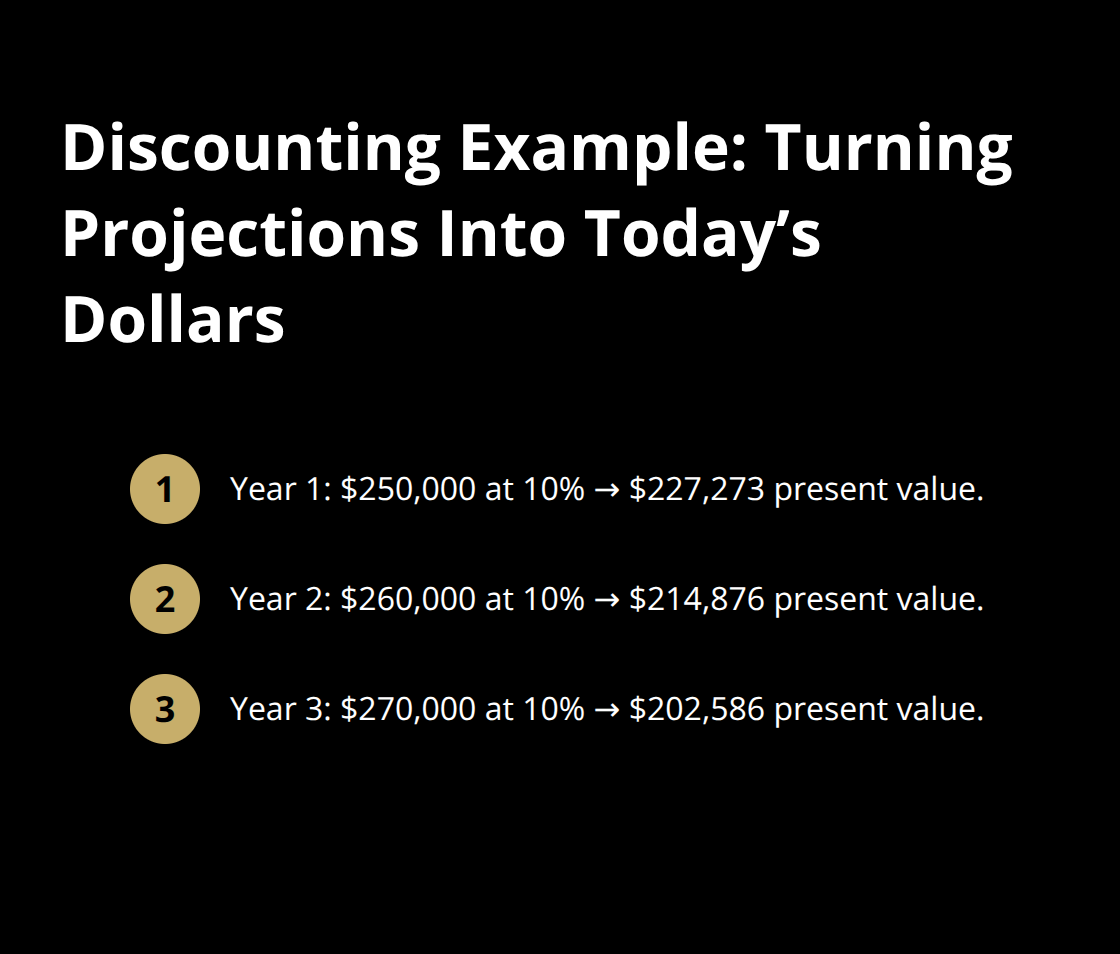
Year three’s $270,000 becomes $202,586.
The further out the cash flow, the less it’s worth in today’s dollars, and this effect accelerates at higher discount rates. A business that generates $300,000 annually in perpetuity is worth roughly $3 million at a 10 percent discount rate but only $2 million at a 15 percent rate. This mathematical reality explains why discount rate selection dominates valuation outcomes. Small changes in your discount rate produce massive swings in final value because you apply that rate across multiple years of projections.
Earnings Multiples: The Shortcut That Hides Assumptions
Earnings multiples work differently but produce the same result through a shortcut. If comparable businesses in your industry sell at 4.5 times EBITDA, and your target business generates $500,000 in EBITDA, the valuation is $2.25 million. These multiples come from market data, whether from public company trading multiples or recent private transaction multiples adjusted for size and risk differences.
The problem with multiples is that they hide assumptions. That 4.5x multiple assumes certain growth rates, risk profiles, and market conditions. When you strip it back, you’re really applying an implied discount rate and growth assumption embedded in the multiple itself. Many valuers grab a multiple from an industry report and apply it mechanically without understanding what business quality that multiple assumes. A 4.5x multiple might assume a business with 20 percent margins and stable customers. If your target business has 12 percent margins and concentrated revenue, the appropriate multiple is lower. The multiple approach works only when you understand the underlying assumptions and adjust for differences between comparables and your target business.
Aligning Your Metrics for Defensible Results
Capitalization rates, present value calculations, and earnings multiples all measure the same economic reality from different angles. The capitalization rate expresses what the market pays per dollar of current income. Present value calculations project future income and discount it backward. Earnings multiples apply market-derived shortcuts to current or normalized earnings. Each method should produce a similar valuation range if your assumptions are consistent and grounded in market data.
The valuers who produce indefensible results typically mix methods without alignment. They apply a high capitalization rate derived from risky comparable businesses to a stable target company. They use conservative cash flow projections with a low discount rate, or aggressive projections with a high rate. These mismatches create internal contradictions that collapse under scrutiny. Your metrics must reflect the same risk environment and the same assumptions about growth, stability, and market conditions. When you move to common pitfalls in the next section, you’ll see how these metric choices interact with real-world valuation errors.
Common Pitfalls and How to Avoid Them
Revenue growth projections that disconnect from market reality
The gap between a theoretically sound valuation and one that actually holds up in a deal often comes down to three execution errors that compound each other. Revenue growth projections sit at the top of the list because they remain invisible until the deal closes and reality diverges from assumptions. A valuer projects 7 percent annual growth over five years based on the owner’s strategic plan, but that plan assumes market expansion that never materializes, or it ignores competitive pressure from new entrants. The math compounds quickly-7 percent growth over five years produces 40 percent cumulative revenue increase, which feeds directly into cash flow projections and terminal value.
If actual growth comes in at 4 percent, you’ve overstated earnings power by roughly 25 percent across the forecast period. The solution demands brutal honesty about what the market data actually supports. If your industry averaged 3.2 percent growth over the last decade according to IBISWorld or similar sources, your projection of 6 percent requires documented evidence that this specific business will outperform its peers. Most valuers skip this step and rely on management’s optimism instead.
Discount Rates as Risk-Specific Calculations, Not Generic Numbers
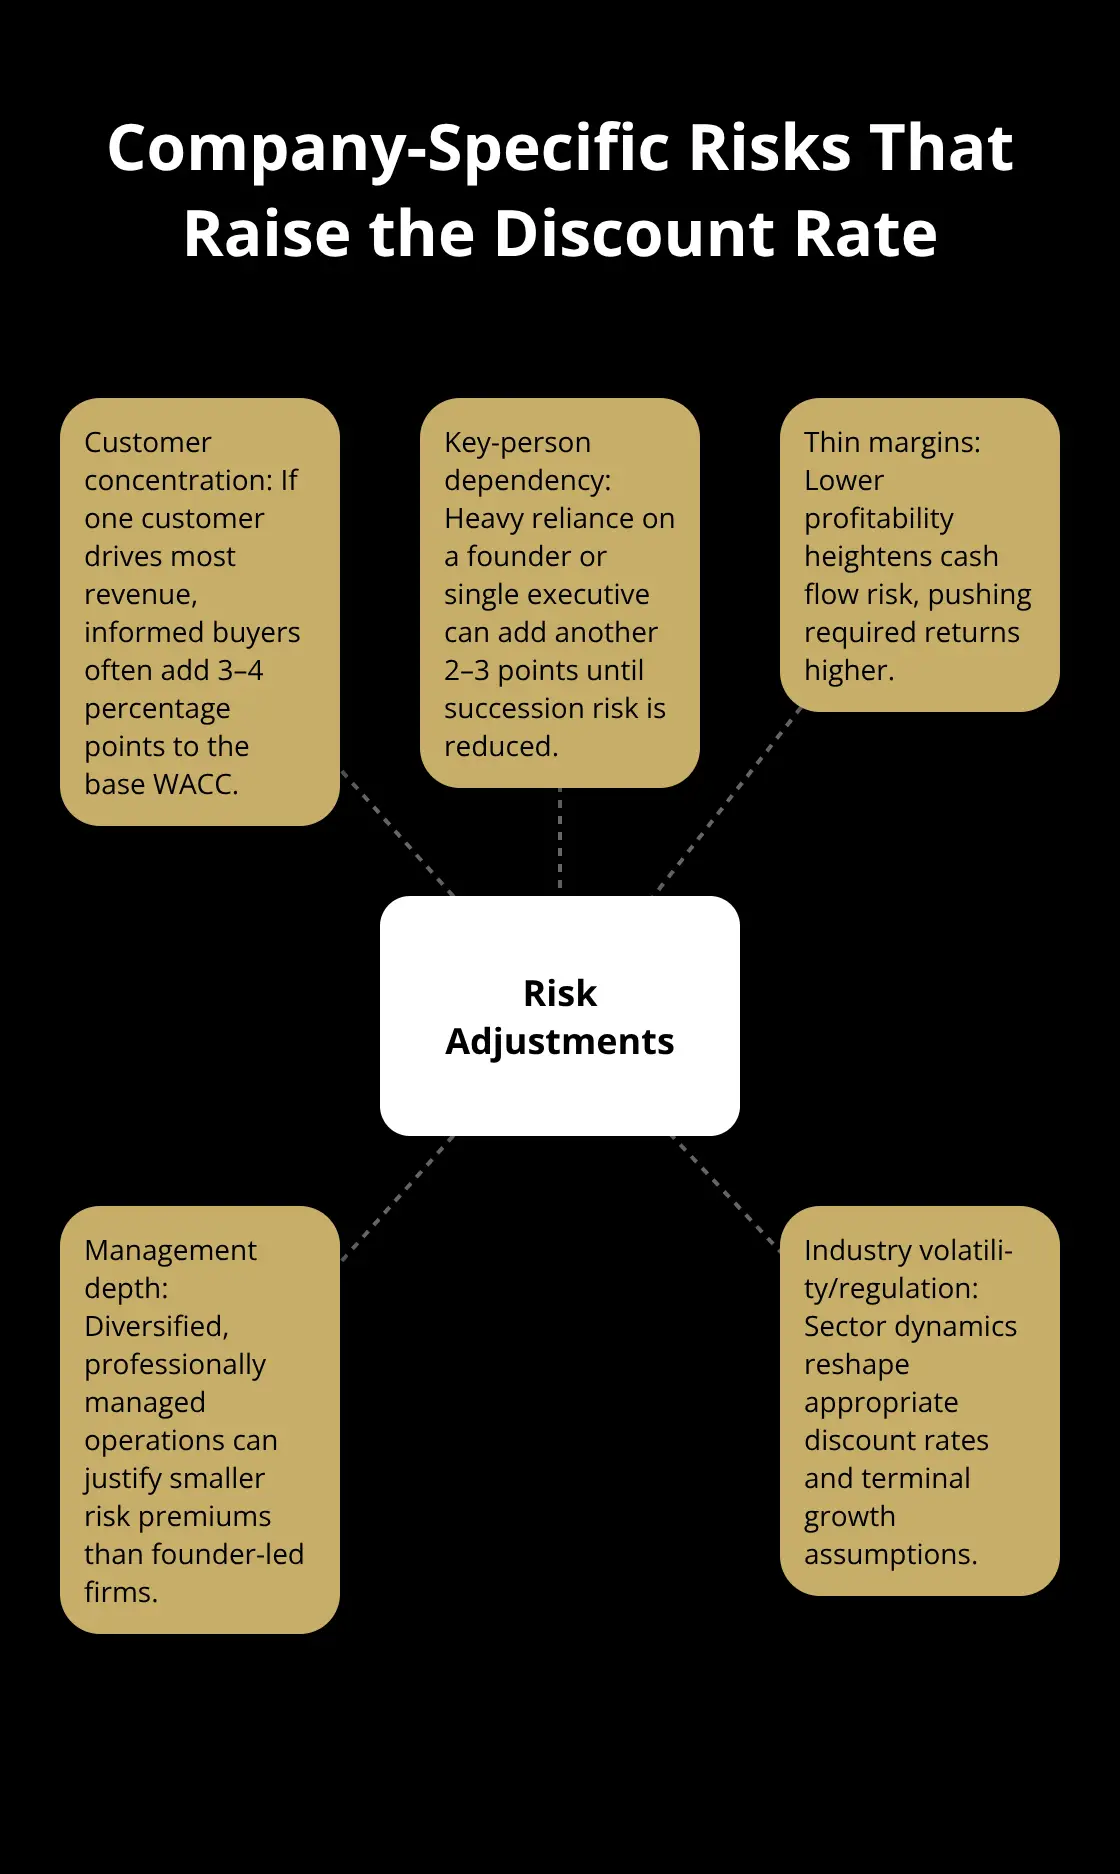
The second failure mode treats discount rates as a single number rather than a risk-specific calculation. A business with 70 percent revenue concentration in one customer, a founder approaching retirement, and thin operating margins carries fundamentally different risk than a diversified business with professional management and 25 percent margins. Yet many valuers apply a standard 10 or 12 percent discount rate across completely different risk profiles.
The weighted average cost of capital approach works only if you actually calculate the cost of debt and equity specific to the business being valued, then adjust for company-specific risk factors. A customer-concentrated business might add 3 to 4 percentage points to the base WACC. A key-person dependency adds another 2 to 3 points. These adjustments aren’t arbitrary-they reflect what informed buyers actually demand as return premiums for taking on those risks.
Industry Dynamics That Reshape Valuation Assumptions
The third pitfall compounds the first two: ignoring how industry dynamics shift valuation assumptions. A software-as-a-service business in a market disrupted by AI faces different growth and competitive dynamics than one in a stable, mature sector. A healthcare staffing firm operates under regulatory constraints that a general staffing firm does not. These industry-specific variables reshape what capitalization rates, discount rates, and terminal growth assumptions should be.
A valuer who applies generic metrics without understanding how industry conditions affect the target business produces a number that disconnects from market reality. The answer is methodical comparison: find three to five recent transactions in your specific industry, extract the implied capitalization rates or discount rates from those deals, and justify any deviation from those market-derived benchmarks with concrete evidence.
Final Thoughts
The income approach valuation method works because it forces discipline into the valuation process. You cannot hide behind market comparables or balance sheet assets. You must project what a business will actually earn, discount those earnings to present value, and justify every assumption with market data. This rigor separates valuations that survive negotiation from ones that collapse when a buyer’s accountant asks hard questions.
Start by normalizing three to five years of historical earnings, removing one-time items and owner discretionary expenses. Project forward using industry growth benchmarks, not management optimism. Calculate your discount rate by determining the weighted average cost of capital, then adjust upward for company-specific risks like customer concentration or key-person dependencies. Apply that rate consistently across your cash flow projections and terminal value calculations. Source your capitalization rates and earnings multiples from actual recent transactions in your industry, not generic reports.
The income approach valuation method matters most when you value a profitable, established business with predictable cash flows. If your business generates consistent earnings and you can reasonably project future performance, this method produces a defensible valuation. At Unbroker, we help business owners navigate the entire sale process with transparent pricing and expert support, whether you want hands-off selling or prefer to lead the process yourself with professional guidance.